Monday, February 22, 2016

Six unusual steps for a successful Twitter lead generation campaign

Do you want more qualified leads?


Twitter can generate qualified leads at a lower cost than most of the other major ad platforms. Its true! But not if you follow Twitters instructions.


Why? Because Twitters advice for creating lead generation cards is completely wrong.


In this post, youll discover my unusual six-step strategy for using Twitter lead generation cards for ludicrously successful lead gen.


Please note: this article was first published on the Wordstream blog last week, and it was so darn helpful that we wanted to share it here.


Step 1: Set up Conversion Tracking. Just do it!


This is kind of buried in the user interface, but its actually the most important thing you need to do. Without conversion tracking set up youre blind.


All the major platforms, except for Twitter, have a universal tag where you put in one tag on your site so you can figure out the conversions just by typing in the URL.


But on Twitter you have to create different JavaScript tags for each thank you page. Each one gets a name and you can categorize the type (download, purchase, sign-up) so that you can report on it later.


twitter-ads-conversion-tracking


Im blown away how many people forget this critical step. Basically you need to define a different conversion pixel for every goal completion on your site so that you can track whether everything is working.


Step 2: Choose your Twitter Ads campaign type wisely


There are six pay-per-performance campaign types, depending on your marketing objective. You specify the most youre willing to pay for each type of campaign.


create-twitter-ads-campaign


Why not just specify $0.01 as your cost per action? Well, basically if you set the bids too low, youll get no impressions. Its an auction. Chances are other Twitter advertisers are willing to pay more than a penny.


The more youre willing to pay, the more likely your ads will be shown. You have to figure out what its worth to you; Twitter will figure out how much quantity youll get for that amount.


As for the campaign types, even though tweet engagements are the most popular type of ad campaign, they offer the absolute worst ROI. Avoid like the plague!


Why? Twitter charges per engagement. This includes engagements such as a person viewing your profile page, expanding your image, expanding the tweet from the tweet stream, or clicking on a hashtag. Twitter will love taking your money, but these campaigns wont help you achieve any of your marketing objectives as you waste your budget.


What you should really be interested in paying for is website clicks, app installs, followers, leads, or actual video views.


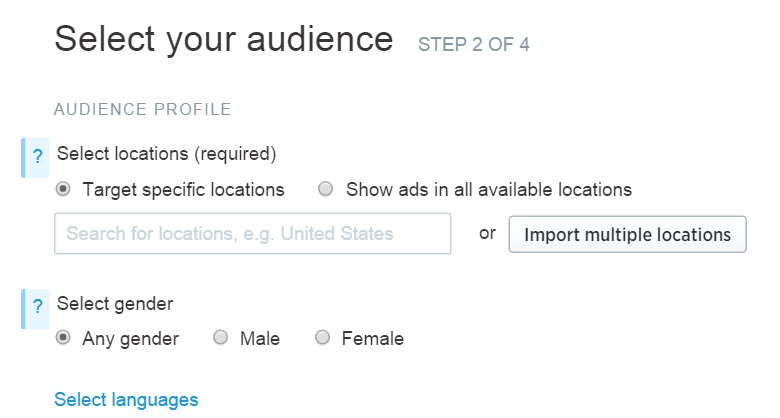
Step 3: adjust your Twitter Ad targeting options


At the basic level, you can simply target Twitter users by location, gender, and language.


twitter-ads-basic-ad-targeting


Twitter also provides somewhat more advanced options:


twitter-ads-advanced-ad-targeting


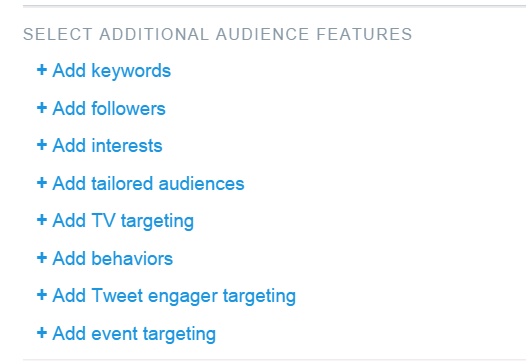
These advanced targeting options include:


  • Keywords: You will target specific searches or users who use with certain keywords in tweets.

  • Followers: You will target accounts of people with interests similar to followers of those accounts. For example, entering @SMExaminer will target people who are likely to be interested in social media.

  • Interests: You will target users interested in any categories you enter.

  • Tailored audiences: This is the crown jewel of Twitter advertising. Remarketing and custom lists are so powerful. Spend here first! Tailored audiences offer the best ROI because you have certainty over who youre targeting. People who are more familiar with your brand are more likely to buy its your lowest-hanging fruit.

  • TV targeting: You will target people who are interested in a specific program, TV network, or TV genre.

  • Behaviors: You will target users who share specified online and offline behaviors and characteristics.

  • Tweet engager: This is a brand new option its kind of like remarketing for Twitter. Its targeting people who interacted with your tweets in the last few days. If you have a business where you need to get lots of people really excited about something (like a political party trying to energize the base ahead of an election), then this can be a powerful type of targeting.

  • Event targeting: You will target people who are interested in global or regional events.


Step 4: Create your ad But DONT use Twitter lead generation cards!


Now its time to create your lead gen ad. Twitter tells you to use a lead generation card. WRONG!


Never, ever use Twitters Lead Generation Cards for lead generation. I have run thousands of campaigns and the lead generation cards consistently lose and lose badly.


Even though it has a nice layout with customizable call-to-action buttons like buy now and all sorts of fancy bells and whistles, it looks more like an ad. Twitter people are allergic to advertising; when they see a Twitter ad it makes them want to click on it less!


If something looks like an ad on Twitter, users will ignore you! That means lower engagement and 2-4x higher costs.


Instead you should just attach a funny photo. Use images that have done well organically to save money.


Go nuts on the image you choose. Dont be afraid to be a bit snarky or goofy. Use funny images or memes, even if it means going a bit off-brand. Twitter is a place where youll be rewarded if your brand shows it can have a bit of fun (within good taste, of course), or youll be ignored if you go all corporate.


And of course, use emojis to further increase engagement rates by 30%.


Step 5: Set Bids No Automatic Bidding Allowed


Okay, first: Never ever use Twitters Automatic Bidding. Its for suckers.


Automatic bidding will make sure your budget is spent very quickly. Sure, it helps you win ad auctions, but you dont really have to or want to win every auction.


Keep in mind its not like search advertising where youre bidding on rare priceless keywords that get searched on 10 times per year. This is display advertising and there are plenty of ad spots available to buy.


Always use maximum bidding. For most companies doing lead generation, its not the end of the world if the lead comes in tomorrow vs. today.


The only time you would use automatic bidding is if you need to promote something heavily and you need those ad impressions today (e.g., you have a 24-hour sale) or if youre targeting a very tight audience, maybe 1,000 people. In these cases, then you do have to use auto bidding or just bid really high.


automatic-bidding-twitter-ads


Okay, so how the heck do you set bids? Its seriously complicated its pretty much rocket science.


You need to use The Force.


Basically, youre trying to get as many impressions as you can for as little money as possible. If you bid too low your ads wont show. But if you bid too high your budget will die.


When you bid too high, youre essentially paying for premium next-day air service when usually (99% of the time) a regular postage stamp will suffice. Youre paying much more for the same clicks in order to be delivered faster.


Twitter has a tool that shows how your reach changes based on different maximum bid amounts.


twitter-lead-gen-estimated-reach-calculator


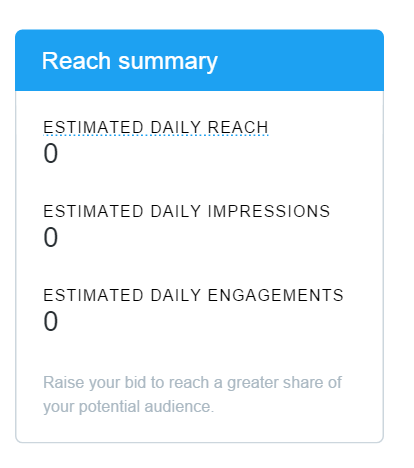
Ignore! Ignore! Ignore! Its completely wrong. Even when it says I will get no impressions, I get millions of impressions. It is just trying to get you to raise bids.


Ive reverse-engineered the Twitter ad auction. Basically Twitter determines if your ads show or not based on your effective CPM. (Your max bid times applicable predicted engagement rate). So if your bid is $1 per click and youre doing a click campaign using an ad that is averaging a 1% click-through rate, then your predicted effective CPM is $10.


To win more ad auctions, you have two choices: either bid more or post higher engagement stuff.


I love promoting high engagement tweets (15%+ engagement rates) with very low maximum CPCs (5-10 cents). The higher the engagement, the less youll need to bid for your ads to be eligible to show.


Step 6: Report. Rinse. Repeat


Your last step is to figure out how things did. You can get detailed information about exactly what happened after spending money on Twitter ads: clicks, retweets, followers, conversions, etc.


twitter-lead-gen-cards-reporting


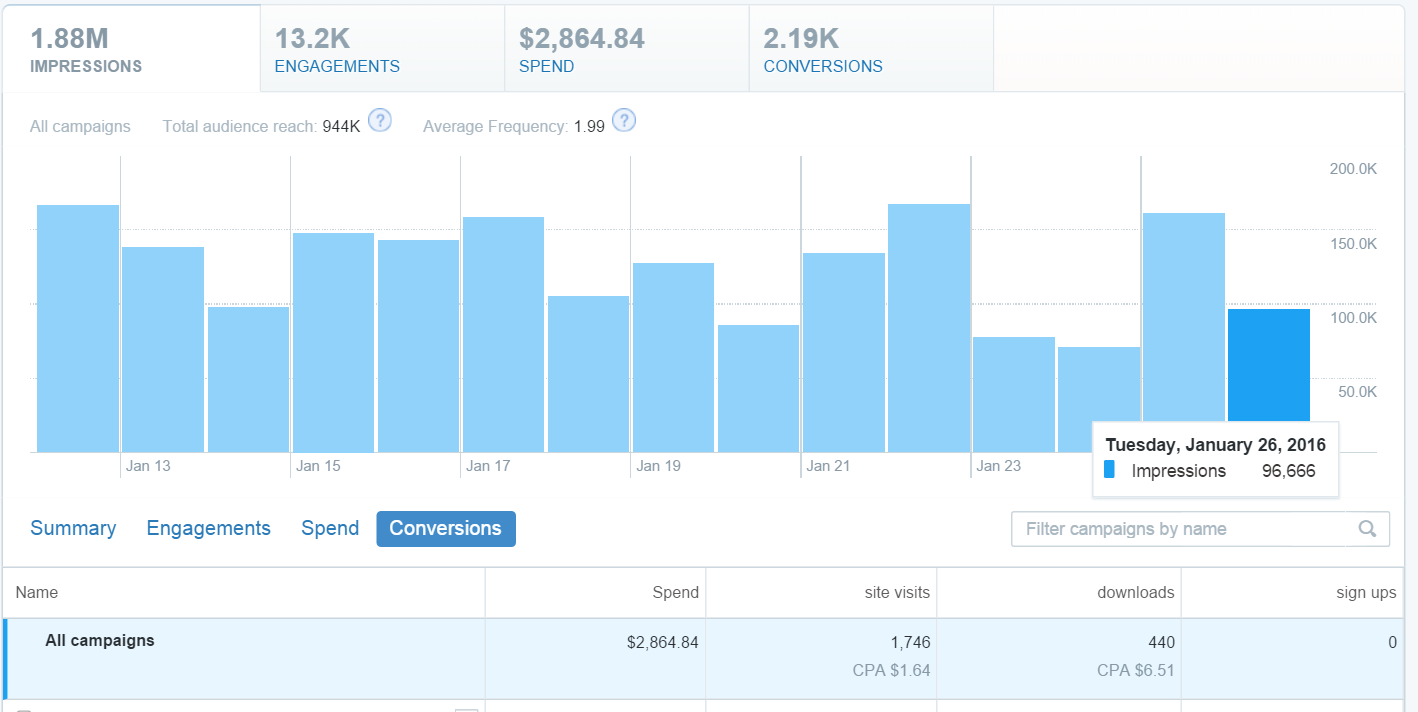
In the above campaign you can see that we were able to generate 440 downloads for just $6.50 per action. Thats extremely cost-effective compared to other marketing channels. In comparison search ads in this vertical can cost closer to $5 per click (not per download).


Delete campaigns that arent working. Double down on stuff that works. Repeat.


Conclusion


Twitter can be very powerful. For example, Twitter ad campaigns can deliver a great return on your investment once you master the Twitter ads quality score algorithm.


But you have to avoid the pitfalls (hello, Tweet Engagement campaigns!). When it comes to advice, Twitter cant be trusted. Forget everything Twitter has tried to tell you about lead generation. Ignore Twitters best practice advice on bidding, creative, audience targeting, campaign types and pretty much everything else.


Instead, do Twitter lead generation my way. The RIGHT way. :)

Sunday, February 21, 2016

Google is removing all Right Hand Side Ads on SERPs worldwide

As reported and confirmed by numerous sources, Google will no longer be showing AdWords ads on the right hand side of its search results pages.


Beginning Friday 19 February, ads will now only show ads at the top and bottom of the SERP. Although it may increase the number of ads from three to four if the search query is "highly commercial."


london hotel Google Search with right hand side ads


Here today, but not tomorrow.


This roll-out will effect users worldwide in all languages and will bring the desktop experience closer to the mobile experience, although whether the amount of ads shown to mobile users will increase hasn't been confirmed.


So what does this mean for marketers and users alike?


Well for regular users, the right-hand space will still be utilised for Product Listing Ads (PLAs) as well as Knowledge Graph Boxes, so you probably won't notice much of a difference there. However the continual 'pushing down' of organic listings will certainly be an issue for many of us.


For businesses this will mean the organic space is even more precious will therefore lead to an even bigger focus on SEO


For Paid Search advertisers the change will certainly drive up average CPCs as the competition for the top slots increases. It's gonna get ugly.


So why limit the amount of space for advertisers on its SERPs?


According to The Media Image (one of the first to break the story) the reason for this may well be because "Google has determined the average click-through-rate for Right Hand Side Ads is poor across verticals, and the expected CPC inflation from this major change is projected to more profitable in the long run."


The "complete and permanent" roll-out will be finalised on 22 February.


If you have anything to add to the story please comment below...

Friday, February 19, 2016

Which US sites lost the most amount of Google visibility in 2015?

Earlier this week, we looked at the US sites that made the biggest SEO gains in 2015, but now it's time to find out who the losers were.


Again, a huge thank you to Juan Gonzalez from Sistrix who spent his time evaluating 200 US domains to give us this exclusive research.


Here's Juan's insight for each of the bottom five:


1) Thefind.com


Thefind also headlined our UK losers list. When we look at the rocky landscape of Thefind.com it becomes clear that the domain managed to rush headlong into numerous Google updates, over the years. Such an erratic visibility is a sign that the page did not show the necessary quality signals where Google's algorithms are concerned, nor did it manage to live up to users' expectations.


the find visibility


The abrupt end for Thefind.com in 2015 came at the hand of Facebook, who bought the company in a bid to incorporate it into Facebook's advertising engine.


2) Cupertino.org


Looking at Cupertino.org we see an interesting spike in January 2015. The same spike can be found for other city websites, such as lakewood.org and austintexas.org.


cupertini lakewood visibility


I spent some time digging into this and found that between 12/22/2014 and 01/16/2015 all three domains were ranking for "department of community services", "parks department", "community parks", "parks and recreation department" and "city of parks and recreation".


Parks and Recreation is also, of course, a television sitcom, which aired its finale in February 2014.


Looking at Google Trends, US users seem to be quite interested in "parks and recreation" from December to June. But we also notice an unusual spike for the keyword "parks in recreation" from the middle of December 2014 to January 2015. (The final season aired from January 13, 2015 to February 24, 2015.)


Maybe because the show was ending, its fans started to search for information about Parks and Recreation and Google overreacted with the QDF ('Query Deserves Freshness') for this and related keywords.


3) Chow.com


The domain Chow.com now redirects to Chowhound.com, the name of the former forum for the site.


chow visibility


While the redirects seem to be solid, it seems as though Google does not trust the user-generated content on the new domain as much as before, leaving an overall loss of visibility of nearly 50%.


chowhound visibility


This is a little sad as Chow.com actually managed to come out of Panda quite well and even managed to gain visibility thanks to the Phantom update, before the domain name change.


4) Espnfc.com


The case of ESPNs soccer page, espnfc.com, is quite interesting.


espnfc visibility chart


When we look at the visibility history for espnfc.com and espnfc.us, we see a rather typical up and down which often hints at duplicate content issues. On 08/24/2015 this all changes and the espnfc.us page comes out on top.


espnfc visibility chart 02


When we look at the sourcecode of both pages we notice a canonical combined with a hreflang attribute. While the canonical always points to the .com version of the page, the tells Google to show the .us version in the Google.com SERPs.


hreflanf tag examples


This setup may come back to bite them later as it can confuse the Googlebot. As John Mueller from Google has noted:


"If the URLs are really fully equivalent, then using a rel=canonical like that is fine (eg if you have an informational page on a site, which doesn't mention local currencies or local addresses). On the other hand, if the pages are not fully equivalent (eg different titles, currencies, addresses, etc), then I would not use a rel=canonical. The difference is very subtle and because of that, hard to implement at scale".


5) Businessweek.com


While Businessweek did not make the top five in our UK losers list, it did get an honourable mention.


Visibility-of-Businessweek.com_


Businessweek was bought by Bloomberg back in 2009 but kept its own domain until last year, when it became part of bloomberg.com on http://www.bloomberg.com/businessweek.


When we compare the visibility for Businessweek.com with the /businessweek directory on Bloomberg.com, we find that the magazine did not pass it's visibility on to the new directory.


Businessweek.com visibility


The reasons here are, once again, soft-404 problems when redirecting each page to the new directory. When we look at the redirects from http://www.businessweek.com/technology/ through URI Valet, for example, we see the first 301 redirect to http://www.bloomberg.com/bw/technology/, next we get a 302 redirect from http://www.bloomberg.com/bw/technology/ to the start page http://www.bloomberg.com/, which constitutes the soft-404. That's the problem.


Others interesting 'losers'


Guitaretab.com


Another interesting domain on the losing side is guitaretab.com. They lost nearly all their visibility in the week of 01/04/2016. This looks like a manual de-indexing penalty as the indexed pages during this week also went down to 0.


guitar tab visibility


We could speculate that the copyright removals might have played their part.


Right now, the domain is only ranking for brand keywords and not much else.


Microsoft


It also seems that Microsoft is using the same SEOs for all of their domains, as many of their service-domains show up on our losers list: Windowsphone.com, Technet.com, Msdn.com and Bing.com

Four Ads on Top: The Wait Is Over

Posted by Dr-Pete

For the past couple of months, Google has been testing SERPs with 4 ads at the top of the page (previously, the top ad block had 1-3 ads), leading to a ton of speculation in the PPC community. Across the MozCast data set, 4 ads accounted for only about 1% of SERPs with top ads (which matches testing protocol, historically). Then, as of yesterday, this happened:


Over the past 2 weeks, we've seen a gradual increase, but on the morning of February 18, the percentage of top ads blocks displaying 4 ads jumped to 18.9% (it's 19.3% as of this morning). Of the 5,986 page-1 SERPs in our tracking data that displayed top ads this morning, here's how the ad count currently breaks down:


As you can see, 4-ad blocks have overtaken 2-ad blocks and now account for almost one-fifth of all top ad blocks. Keep in mind that this situation is highly dynamic and will continue to change over time. At the 19% level, though, it's unlikely that this is still in testing.

Sample SERPs & Keywords

The 4-ad blocks look the same as other, recent top ad blocks, with the exception of the fourth listing. Here's one for "used cars," localized to the Chicago area:


Here's another example, from an equally competitive search, "laptops":


As you can see, the ads continue to carry rich features, including site-links and location enhancements. Other examples of high-volume searches that showed 4 top ads in this morning's data include:


    • "royal caribbean"
    • "car insurance"
    • "smartphone"
    • "netbook"
    • "medicare"
    • "job search"
    • "crm"
    • "global warming"
    • "cruises"
    • "bridesmaid dresses"


Please note that our data set tends toward commercial queries, so it's likely that our percentages of occurrence are higher than the total population of searches.

Shift in Right-column Ads

Along with this change, we've seen another shift - right-hand column ads seem to be moving to other positions. This is a 30-day graph for the occurrence of right-hand ads and bottom ads in our data set:


The same day that the 4-ad blocks jumped, there was a substantial drop in right-column ad blocks and corresponding increasing in bottom ad blocks. Rumors are flying that AdWords reps are confirming this change to some clients, but confirmation is still in progress as of this writing.

Where is Google Headed?

We can only speculate at this point, but there are a couple of changes that have been coming for a while. First, Google has made a public and measurable move toward mobile-first design. Since mobile doesn't support the right-hand column, Google may be trying to standardize the advertising ecosystem across devices.

Second, many new right-hand elements have popped up in the last couple of years, including Knowledge Panels and paid shopping blocks (PLAs). These entities push right-hand column ads down, sometimes even below the fold. At the same time, Knowledge Panels have begun to integrate with niche advertising in verticals including hotels, movies, music, and even some consumer electronics and other products.

This is a volatile situation and the numbers are likely to change over the coming days and weeks. I'll try to update this post with any major changes.


Sign up for The Moz Top 10, a semimonthly mailer updating you on the top ten hottest pieces of SEO news, tips, and rad links uncovered by the Moz team. Think of it as your exclusive digest of stuff you don't have time to hunt down but want to read!

Thursday, February 18, 2016

Success Metrics in a World Without Twitter Share Counts

Posted by EricaMcGillivray

On November 20, 2015, Twitter took away share counts on their buttons and from their accessible free metrics. Site owners lost an easy signal of popularity of their posts. Those of us in the web metrics business scrambled to either remove, change, or find alternatives for the data to serve to our customers. And all those share count buttons, on sites across the Web, started looking a tad ugly:

Where's my shares?Yep, this is a screenshot from our own site.

Why did Twitter take away this data?

When asked directly, Twitter's statement about the removal of tweet counts has consistently been:

"The Tweet counts alone did not accurately reflect the impact on Twitter of conversation about the content. They are often more misleading to customers than helpful."

On the whole, I agree with Twitter that tweet counts are not a holistic measurement of actual audience engagement. They aren't the end-all-be-all to showing your brand's success on the channel or for the content you're promoting. Instead, they are part of the puzzle -- a piece of engagement.

However, if Twitter were really concerned about false success reports, they would've long ago taken away follower counts, the ultimate social media vanity metric. Or taken strong measures to block automated accounts and follower buying. Not taking action against shallow metrics, while "protecting" users from share counts, makes their statement ring hollow.

OMG, did Twitter put out an alternative?

About a year ago, Twitter acquired Gnip, an enterprise metrics solution. Gnip mostly looks to combine social data and integrate it into a brand's customer reputation management software, making for some pretty powerful intelligence about customers and community members. But since it's focused on an enterprise audience, it's priced out of the reach of most brands. Plus, the fact that it's served via API means brands must have the knowledge and development skills/talent in order to really customize the data.

Since the share count shutdown, Gnip released a beta Engagement API and has promised an upcoming Audience API. This API seems to carry all the data you'd need to put those share counts back together. However, an important note:

"Currently only three metrics are available from the totals endpoint: Favorites, Replies, and Retweets. We are working to make Impressions and Engagements available."

For those of you running to your favorite tools -- Gnip's TOS currently forbids the reselling of their data, making it essentially forbidden to integrate into tools, although some companies like Buzzsumo have paid and gotten permission to use the data in their software. The share count removal caused Apple to quietly kill Topsy.

Feel social media's dark side, Twitter

Killing share counts hasn't been without its damage to Twitter as a brand. In his post about brands who's lost and won in Google search, Dr. Pete Meyers notes that Twitter dropped from #6 to #15. That has to hurt their traffic.

Twitter lost as a major brand on Google in 2015

However, Twitter also made a deal with Google in order to show tweets directly in Google searches, which means Twitter's brand may not be as damaged as it appears.

Star Wars tweet stream in Google results

Perhaps the biggest ding to Twitter is in their actual activity and sharing articles on their platform. Shareaholic reports sharing on Twitter is down 11% since the change was implemented.

Share of voice chart on Twitter from Shareaholic

It's hard to sell Twitter as a viable place to invest social media time, energy, and money when there's no easy proof in the pudding. You might have to dig further into your strategy and activities for the answers.

Take back your Twitter metrics!

The bad news: Almost none of these metrics actually replicate or replace the share count metric. Most of them cover only what you tweet, and they don't capture the other places your content's getting shared.

The good news: Some of these are probably better metrics and better goals.

Traffic to your site

Traffic may be an oldie, but it's a goodie. You should probably already be tracking this. And please don't just use Google Analytics' default settings, as they're probably slightly inaccurate.

Google Analytics traffic from Social and Twitter

Some defaults for one of my blogs, since I'm lazy.

Instead, make sure you tag what you're sharing on social media and you'll be better able to attribute your hard, hard work to the proper channels. Then you can really figure out if Twitter is the channel for your brand's content (or if you're using it right).

Use shortening services and their counters

Alternatively, especially if you're sharing content not on your own site, you can use share and click counting from various URL shortening services. But this will only count toward individual links you share.

Bit.ly's analytics around share counts for individual links

Twitter's own free analytics

No, you won't find the share count here, either. Twitter's backends are pretty limited to specific stats on individual tweets and some audience demographics. It can be especially challenging if you have multiple accounts and are working with a team. There is the ability to download reporting for further Excel wizardry.

Tweet impressions and Twitter's other engagement metrics

Twitter's engagement metric is "the number of engagements (clicks, retweets, replies, follows, and likes) divided by the total number of impressions." While this calculation seems like a good idea, it's not my favorite, given the specific calculation's hard to scale as you grow your audience. You're always going to have more lurkers instead of people engaging with your content, and it's going to take a lot of massaging of metric reporting when you explain how you grew your audience and those numbers went down. Or how the company with 100 followers does way better on Twitter's engagement metric.

TrueSocialMetric's engagement numbers

Now these are engagement metrics that you can scale, grow, and compare. Instead of looking at impressions, TrueSocialMetrics gives conversation, amplification, and applause rates for your social networks. This digs into the type of engagement you're having. For example, your conversation rate for Twitter is calculated by taking how many comments you got and dividing it by how many times you tweeted.

TrueSocialMetric's engagement numbers

At Moz, we use a combination of TrueSocialMetrics and traffic to report on the success of our social media efforts to our executives. We may use other metrics internally for testing or for other needs, depending on that specific project.

Twitcount

Shortly after the removal of share counts was announced, Twitcount popped up. It works by installing their share counters on your site, where it then can surface historical totals. Twitcount's numbers only start counting the day you install the code and the button to your site. There are limitations, since they use Twitter's API, and these limitations may cause data inaccuracies. I haven't used their solution, but if you have, let us know in the comments how it went!

Buffer's reach and RT metrics

Again, this only counts for your individual tweet's metrics, and Buffer only grabs metrics on tweets sent out via their platform. Buffer's reach metric is similar to what many traditional advertisers and people in public relations are used to, and it is similar to Twitter's general impressions metric. Reach looks at how far your tweet has possibly gone due to size of the retweeter's audience.


Like most analytic tools, you can export the metrics and play with them in Excel. Or you can pay for Buffer's business analytics, which runs between $50-$250/month.

Trending topics and hashtag reports

There are many tools out there where you can track specific trends and hashtags around your brand. At MozCon, we know people are tweeting using #MozCon. But not every brand has a special hashtag, or even knows the hot topics around their brand.

SproutSocial's trends report is unique in that it pulls both the topics and hashtags most associated with your brand and the engagement around those.


Obviously, in last July, #MozCon is hot. But you can also see that we have positive community sentiment around our brand by what else is happening.

Buzzsumo

Our friends at Buzzsumo can be used as a Topsy topic replacement and share counter. They did a great write-up on how to use their tool for keyword research. They are providing share counts from Gnip's data.

Share counts from BuzzSumo

Though when I ran some queries on Moz's blog posts, there seemed to be a big gap in their share counts. While we'd expect to see Moz's counts down a bit on the weekends, there would be something there:

BuzzSumo on Moz's share counts over the week

I'm unsure if this is Buzzsumo's or Gnip's data issue. It's also possibly that there are limits on the data, especially since Moz has large numbers of followers and gets large amounts of shares on our posts.

Use Fresh Web Explorer's Mention Authority instead

While Fresh Web Explorer's index only covers recent data -- the tool's main function being to find recent mentions of keywords around the web a la Google Alerts -- it can be helpful if you're running a campaign and relying on instant data no older than a month. Mention Authority does include social data. (Sorry, the full formula involved with creating the score is one of Moz's few trade secrets.) What's nice about this score is that it's very analogous across different disciplines, especially publicity campaigns, and can serve as a holistic alternative.

Fresh Web Explorer's mention authority

Embedded tweets for social proof

Stealing this one from our friends at Buffer, but if you're looking to get social proof back for people visiting your post, embedded tweets can work well. This allows others to see that your tweet about the post was successful, perhaps choosing to retweet and share with their audience.

Obviously, this won't capture your goals to hand to a boss. But this will display some success and provide an easy share option for people to retweet your brand.

Predictions for the future of Twitter's share count removal

Twitter will see this as a wash for engagement

With the inclusion of tweets directly in Google search results, it balances out the need for direct social proof. That said, with the recent timeline discussions and other changes, people are watching Twitter for any changes, with many predicting the death of Twitter. (Oh, the irony of trending hashtags when #RIPTwitter is popular.)

Twitter may not relent fully, but it may cheapen the product through Gnip. Alternatively, it may release some kind of "sample" share count metric instead. Serving up share count data on all links certainly costs a lot of money from a technical side. I'm sure this removal decision was reached with a "here's how much money we'll save" attached to it.

Questions about Twitter's direction as a business

For a while, Twitter focused itself on being a breaking news business. At SMX East in 2013, Twitter's Richard Alfonsi spoke about Twitter being in competition with media and journalism and being a second screen while consuming other media.

Lack of share counts, however, make it hard for companies to prove direct value. (Though I'm sure there are many advertisers wanting only lead generation and direct sales from the platform.) Small businesses, who can't easily prove other value, aren't going to see an easy investment in the platform.

Not to mention that issues around harassment have caused problems even celebrities with large followings like Sue Perkins (UK comedian), Joss Whedon (director and producer), Zelda Williams (daughter of Robin Williams), and Anne Wheaton (wife of Wil Wheaton). This garners extremely bad publicity for the company, especially when most were active users of Twitter.

No doubt Twitter shareholders are on edge when stock prices went down and the platform added a net of 0 new users in Q4 of 2015. Is the removal of share counts something in the long list of reasons why Twitter didn't grow in Q4? Twitter has made some big revenue and shipping promises to shareholders in response.

Someone will build a tool to scrape Twitter and sell share counts.

When Google rolled out (not provided), every SEO software company clamored to make tools to get around it. Since Gnip data is so expensive, it's pretty impractical for most companies. The only way to actually build this tool would be to scrape all of Twitter, which has many perils. Companies like Hootsuite, Buffer, and SproutSocial are the best set up to do it more easily, but they may not want to anger Twitter.

What are your predictions for Twitter's future without share counts? Did you use the share counts for your brand, and how did you use them? What will you be using instead?

Header image by MKH Marketing.


Sign up for The Moz Top 10, a semimonthly mailer updating you on the top ten hottest pieces of SEO news, tips, and rad links uncovered by the Moz team. Think of it as your exclusive digest of stuff you don't have time to hunt down but want to read!

Kelvin Newman on the major search trends of 2016 [podcast]

Today sees the release of the ClickZ Digital Marketing Podcast series, featuring some of the experts who contributed to our Digital Trends 2016 report.


It features interviews with Tessa Wegert, Brian Clifton, Kelvin Newman and Parry Malm, looking at key trends for 2016.


Here we'll be taking a look (sorry, listen) to Kelvin Newman's episode on search marketing.


Kelvin is one of the best known figures in the world of search marketing in the UK, being the founder of Rough Agenda and organiser of Brighton SEO.


In Kelvin's podcast we hear what initially attracted Kelvin to search, where he sees the biggest opportunities for marketers entering the industry today and which search marketing trends Kelvin is really excited about in 2016 and why.


SEM in 2016


Kelvin believes there are two main areas that will influence search marketing in 2016. The first being the technology that search engines use and how we as search marketers need to respond to it. In particular machine learning.


Machine learning is used to find patterns and trends in data-sets. Previously it was fairly straightforward for search marketers to use technical on-page SEO to influence ranking factors.


However now, as algorithms become more complex and machine learning becomes more practical, the systems that search engines use to rank websites becomes even less transparent than before.


The upside of this only benefits the user...


"As marketers we just have to concentrate on making our websites better, the experiences we provide, looking at who is performing well and learning from our competitors, rather than taking a 'tick-box approach' to search engine marketing."


And the second major factor that will influence search in 2016 is how search marketers are perceived within organisations and the business of search marketing itself...


"There's a greater need for any marketing professional to ensure that any of their recommendations and strategies are not only right but that they are implemented, so your role as a marketing professional is not only to understand social media or CRO or SEO, your job is to deliver business change."


For search marketers it's important to remember the traditional skills that would otherwise be forgotten if there wasn't a search engine advocate, but also to be the "advocate of web best practice."


For lots more insight, listen to the full podcast here: ClickZ Digital Marketing Podcast.

Wednesday, February 17, 2016

Which US sites gained the highest Google visibility in 2015?

We recently looked at the UK sites that made the biggest SEO gains in 2015, but now it's time to cross the pond to see which US sites did the best last year.


Juan Gonzalez the SEO & Country Manager at Sistrix spent a considerable amount of time last week evaluating 200 domains, and has given us an exclusive look at the top 100.


Please note, we haven't included any adult-entertainment websites in this list - of which there were only three. Also, as there were no major Google updates in 2015, most of these problems were "home-made by the website operators."


The insights below each domain are from Juan himself, so a massive thank you for his input.


1) Choicehotels.com


choice hotels visibility


In May 2015 Choice Hotels consolidated all of its domains - comfortsuites.com, qualityinn.com, comfortinn.com and many more - into the main domain of choicehotels.com.


choices hotels compared to other hotel brands


The redirects are sound but the only hazard may be the fact the consolidated domains still return a 200 status code when a Googlebot useragent visits. It might be a good idea for them to fix this potential cloaking problem soon.


2) Quora.com


visibility-quora.com


We've already looked more closely at Quora in our UK review.


Basically, Quora has cornered the market when it comes to Q&A sites, and has very impressive URLs like https://www.quora.com/Can-I-burn-an-audio-CD-on-a-DVD-R-and-have-it-behave-as-a-CD-R-so-I-can-play-it-in-all-cars-and-players which themselves rank for almost 100 Keywords on Google:


3) Groupon.com


groupon visibility


Groupon managed to massively build up their /coupons/stores/ directory during 2015, so that now a good 33% of the top 10 keywords for the entire domain are generated in this directory.


Looking at the top keywords for the entire domain, there are 65,338 top 100 keywords but only 2,545 top 10 keywords, so there's quite a bit of room for improvement.


groupon visibility


4) Angieslist.com


angieslist search visibility


The crowd-sourced local business review site may be massive when it comes to indexed pages (more than 30 million), though it seems that its quality is not what Google wants.


Out of more than 30 million indexed pages, we found only about 32,000 URLs in the Top 100 results, with less than 1,300 URLs making it into the Top 10.


angieslist search visibility


5) Zomato.com


Again, a domain which we covered in our UK review. Zomato provides exactly the kind of information that Google looks for when it serves localised results to searchers - restaurant reviews, user ratings, photos and menus.


zomato visibility


Much of its improved visibility was down to Zomato's purchase of urbanspoon.com, the content of which redirected to zomato.com from June 2015.


Here's the Top 20 US domains that increased in Google visibility in 2015:


  1. choicehotels.com 397.81%

  2. quora.com 394.40%

  3. groupon.com 195.09%

  4. angieslist.com 189.35%

  5. zomato.com 185.29%

  6. macmillandictionary.com 147.24%

  7. etsy.com 136.76%

  8. academy.com 132.74%

  9. weather.com 130.98%

  10. cambridge.org 129.74%

  11. washingtonpost.com 123.25%

  12. burlingtoncoatfactory.com 119.02%

  13. wayfair.com 106.22%

  14. authoritynutrition.com 103.99%

  15. skyscanner.com 100.06%

  16. mentalfloss.com 99.85%

  17. instagram.com 98.93%

  18. express.com 96.79%

  19. cinemablend.com 95.22%

  20. sears.com 86.87%

Tuesday, February 16, 2016

Revved Up Rankings: History & Filtering at Your Fingertips, New in Moz Pro

Posted by jmodjeska

Today I'm proud to announce some new features in Moz Pro that help you get a lot more value out of your keyword rankings reports. You can now view your full rankings history for any campaign, select specific date ranges for your charts and tables, better segment your rankings data to get a clearer understanding of your performance and visibility, and effectively manage large campaigns with numerous keywords. Did I also mention it's lightning-fast? To get started, visit the keyword rankings page in any of your campaigns or test drive Moz Analytics with a free trial today.

Want a quick recap? Tori goes over the highlights in this quick 1:20 minute video!

Historical rankings: getting from 12 to infinity

The major value of today's release is that it enables customers to visualize their campaign's entire rankings history. This is thanks to an ongoing effort to completely overhaul our data assembly architecture. I'm excited about today's release because it lets loose the first phase of this overhaul initiative, and marks the end of the 12-cycle limitation in our rankings reports.

As of today, timeframe selection has no bounds. You can report on rankings data with start and end dates anywhere in the life of your campaign, up to and including the entire campaign's history, even on campaigns with long histories and lots of keywords. Your full rankings histories have been liberated.

12 weeks of keyword rankings history in Moz Analytics -- a limitation until today


Success! A campaign's entire rankings history in Moz Analytics

And more new features

In addition to unlimited rankings history, we're giving users the freedom to compare rankings, search visibility, engine performance, and competitive metrics within customizable timeframes. We want our users' reporting needs to drive the application, and not vice-versa. Here are some other features available as of today:


  • Customizable timeframe selection. In addition to weekly and monthly views, you can now select and display start and end dates, and export reports for specific timeframes. Rankings deltas (changes over time) are now calculated over the duration of the selected timeframe.

Calendar controls to select your data display range

Quick-select menu for common timeframes


  • Flexible, universal filtering. Fast response times and full keyword history means no more limits on how you view and filter your data. Use the new universal filter to narrow displayed keywords by locality, labels, and keyword text.


  • On-the-fly aggregate calculations. Rankings summaries, deltas, search visibility, and universal results all update on-demand whenever you select a new timeframe.


  • Flexible, fast sorting. Data points -- like difference between rankings by engine -- that previously took so much overhead to calculate that they couldn't be sorted in-place, are now easily sortable on-demand.


Sort by anything, anywhere

And performance improvements, too

These new features are built on an entirely new architecture. We've been running the new and old systems in full parallel mode for about two months now to ensure everything was ready to switch over. This has also given us the opportunity to measure some key performance improvements:


  • 30X faster pipeline. Our data assembly and storage processes run up to 30X faster, eliminating delays between data collection and in-app availability. The low latency between data collection and availability is what facilitates the delivery of full campaign histories.

  • 20X faster server response times. For most in-app requests, our response times are dramatically faster than the previous system. We're seeing rankings datasets delivered in 50 ms for average-sized campaigns (compared to 800+ ms in the previous system). We've also moved many calculations into the browser, reducing network calls and wait times for filter and sort requests.

Why we did all of this

Rankings data is important to our customers

Keyword rankings data is a core component of the Moz Pro suite of tools. We gather localized and national data on millions of keywords each day across hundreds of search engine locales so that our customers can analyze their SEO keyword performance. Moz Analytics users spend the bulk of their time in the Rankings section, where we present metrics that include mobile and desktop keyword rankings, historical SERP analysis, local and national keywords, search visibility scores, and competitive metrics.

The data was already there

We store deep historical rankings data going back to the moment of a campaign's creation. While this information has always been accessible via historical rankings CSV downloads, we've been aware for some time that this is frustrating and this data would be much more useful in the UI. What held us back was our architecture. If you're interested in the technical challenges and how we overcame them to deliver these new features, I offer a detailed explanation on our Developer Blog, covering the project background and architecture that makes all of this possible.

Where we'll go next

We plan to round out our rankings overhaul project with backend and UI updates to the Analyze a Keyword page. We'll also speed up Page Optimization, at which point the entire corpus of ranking-related data will be on our new platform.

Ultimately, all of our numerous datasets, including crawl and links, will be assembled and stored on the new architecture, unlocking new features and delivering data faster as we go. We'll continue to be agile and iterative, progressively releasing updates as soon as they're ready.

So go check it out!

To experience the new features in the rankings section, visit your ranking report in any Moz Analytics campaign. If you're not already a Moz Pro subscriber, why not take a free trial and see how our software can help you do better marketing? As always, we would love to hear your feedback below.


Sign up for The Moz Top 10, a semimonthly mailer updating you on the top ten hottest pieces of SEO news, tips, and rad links uncovered by the Moz team. Think of it as your exclusive digest of stuff you don't have time to hunt down but want to read!